Content
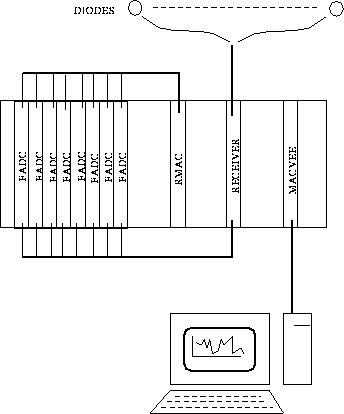
The H1 radiation monitor consists of 16 diodes mounted on CST
and BST. The diodes are read with a VME system, consisting of
Flash ADCs, and a counter card (RMAC).
The Flash ADCs sample the incoming diode signal with 10 MHz. Each
card reads two diodes, i.e. there is in total eight such cards.
The Flash ADC system is mainly used for looking at the pulse shapes
of the incoming signals. The RMAC card has sixteen inputs. During
each second is the number of incoming signals on each input counted,
and the result is stored in a FIFO. The FIFO can then be read
by a remote host. In this case is the remote host a MacIntosh.
The controlling program, RmacVIEW (written in LabVIEW) shows the
differential rate for each second, and the average rate during
six minutes. RmacVIEW do also handle the user communication with
the counter card, i.e. setting up the running conditions. All
activities, rates and commands to the counter card, is logged
in a file on the MacIntosh. This file is once a day transferred
to a main computer for analysis. The results
are available in WWW.

The analog signal from a diode is sampled with a 10 MHz 8 bit FADC VME card. Each VME card reads two diodes. The data is stored in a two bank memory. One bank is written by the FADC, at the same time the other bank can be read by the controlling program. Data is stored in the memory as one 16 bit word, one byte for each diode. Each bank can store 128 kwords. Data is written in the memory when the diode signal exceeds a given threshold, which can be adjusted by writing the value in a register.
The RMAC card takes sixteen analog inputs, and counts during a given period the number of pulses above a programmable threshold (command: Counter thresholds). A counter is a mixture of hardware and software, a six bit hardware counter is regularly read by a microcontroller. The maximum rate the card can handle is 300 KHz per input channel. The summed rate of all sixteen inputs is available as a logarithmic voltage. A relay is switched if the rate exceeds a given alarm level during a longer time period. The microcontroller communicates with an external host through two FIFOs, which are accessible from the VME interface. The FIFOs are 8k word deep, i.e. several hours of data can be stored before overflowing the FIFO. A 1k EEPROM memory is used to store the parameters used by the controller program.
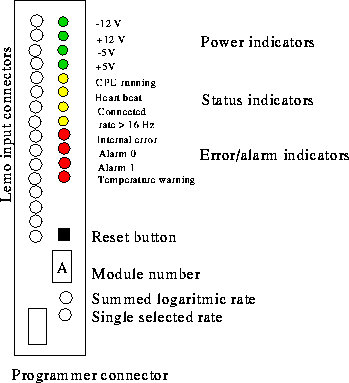
On the front panel are 4 LED voltage indicators, they should all be on when module is functioning properly.
| Color | Voltage | Used for |
| green | -12V | Analog logic |
| green | +12V | Analog logic |
| green | -5V | Comparators |
| green | +5V | Digital logic |
8 LED for status, which is the same as the pattern displayed by RmacVIEW. The normal status of the LEDs is CPU running ON, Heart beat blinking with a period of one second, Remotely connected when the RmacVIEW program on the MacIntosh is running, and errors OFF. Rate and alarm indicators depends on beam conditions.
| Color | Meaning |
| yellow | CPU running |
| yellow | Heart beat, swapped once minor period (second) |
| yellow | Remotely connected |
| yellow | Rate greater than 16 Hz |
| red | Internal error |
| red | Alarm 0 condition fulfilled |
| red | Alarm 1 condition fulfilled |
| red | Temperature warning |
Four open/close relays are connected to the status indicators as:
| Relay | Meaning |
| 1 | Alarm 0 |
| 2 | Alarm 1 |
| 3 | Temperature warning |
| 4 | CPU running |
On two LEMO connectors are the total rate and rate for the selected diode available as a logarithmic voltage, 1V corresponds to one decade. The card is described in more detail in [1] The figure below shows the front panel.
The software consists of three parts, the RamcMON monitor that runs on RMAC, the RmacVIEW user communication program, and FadcVIEW running on the controlling MacIntosh. They are briefly described in this section. A more detailed description of RmacMON can be found in [1].
There are two time periods used. The minor period is the time taken for calculating the rate. The microcontroller program adds up the values during one minor period. The major period is the number of minor periods used for deciding on the alarm conditions. The minor period is given by the program running on the microcontroller, while the major period values can be modified by the external host (command: Alarm periods), one period for each of the two available alarm conditions. Other parts in the alarm conditions are the alarm thresholds (command: Alarm thresholds), the number of diodes required to be above the alarm thresholds during a minor period (command: Diodes above threshold), and the number of minor periods required during one major period (command: Seconds above threshold). The minor period is set to one second.
After a reset is the processor registers initialized with their
initial settings, the counters are cleared and their thresholds
loaded. At the beginning of a minor period is any pending command
in the input FIFO decoded and executed. The counters are read
in a loop until the end of the minor period. For each counter
are the read values added to a software counter, and to the total
sum of all counters. At the end of the minor period is the ADC
conversion started for the next analog input. During the conversion
is the alarm handler called, after which the ADC is read. If it
is a major period the alarm is cleared/set. If there is a remote
connection, the result is stored in the output FIFO, to be read
by the remote host. The value that gives the logarithmic voltage
output of the rate, is fetched from a lookup table.
The run parameters are stored in the EEPROM. The EEPROM space
is divided into parameter sets, at startup is the parameter set
located at address zero used. With the command Fetch from EEPROM
can one select other sets during runtime.
RmacVIEW starts automatically on the controlling MacIntosh. It opens three windows:
One other panel is opened when requested by the operator
A dialog box may appear when the program has found an error which it could not recover from. These boxes are described in more detail below in the dialog box section.
The program runs in a loop, reading the RMAC status register.
When the FIFO contains information is it read and the information
is decoded. If the program is slow in reading the FIFO data accumulates
in the FIFO, and it eventually overflows. The FIFO can store several
hours of data, but the rate panel display will not be updated
with the latest real time information, but with data sampled at
an earlier time. It is recommended not to use the controlling
MacIntosh for other CPU consuming tasks.
RmacView - the main panel
The main panel contain a minimum of information and control buttons.
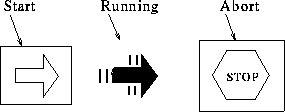
If the program is stopped, is it restarted by pressing the START control field in the menu bar. In case when it is not possible to stop the program normally (with STOP in the control panel described below), can it be aborted by pressing ABORT control field in the menu bar. No end-of-run record is written in the logfile if the program is aborted.
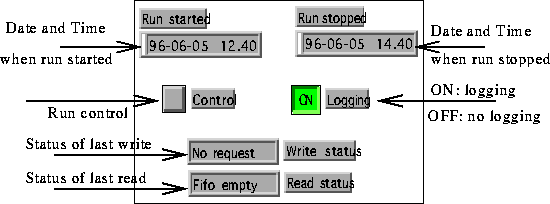
RUN STARTED and RUN STOPPED gives the start and stop (if run stopped) time of present (last) run.
CONTROL opens the control panel, with the possibility to modify the run setup in RmacMON.
LOGGING enables/disables the logging facility. When
enabled are all information exchanged with RmacMON logged in a
file. This file grows up to a maximum size, when it closed and
a new logfile is started. The file grows with 100 kBytes per hour.
These files are automatically moved to a main computer and deleted
afterwards. The files are located in Logfiles/files/RmacLogNNN
in the Rmac root directory, where NNN is a running number. The
current lognumber is stored in the file Logfiles/LogNumber. There
is normally no need to look at these files, unless the automatic
fetch/delete of these files do not work. In the latter case will
the disk eventually become full, if the files are not manually
fetched and deleted. If this happens contact an expert.
WRITE STATUS is the status of the last command written to RmacMON. This status is normally no request.
READ STATUS is the status of the last read access of the Rmac card. This status is normally no error or FIFO empty. All other status messages indicates an error condition.
| Message | Description |
| No error | No error in last card access |
| FIFO empty | The input FIFO is empty |
| Buserror | A bus error occurred in last card access |
| Bad message | The message from RMAC is unknown |
| Bad length | Bad message length |
| No request | No command request pending |
Rate panel
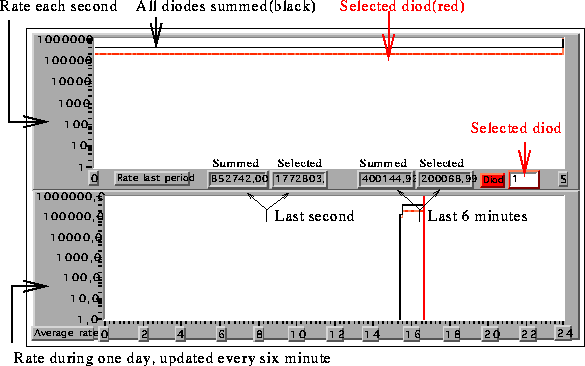
The rate panel shows the differential rate each second, and the average rate the last six minutes during the last 24 hours. The rate shown is the total rate adding all sixteen channels, and the rate for a single selected diode. The display for the differential rate each second is updated every fifth second. The rate is numerically displayed in Rate last period.
Status panel
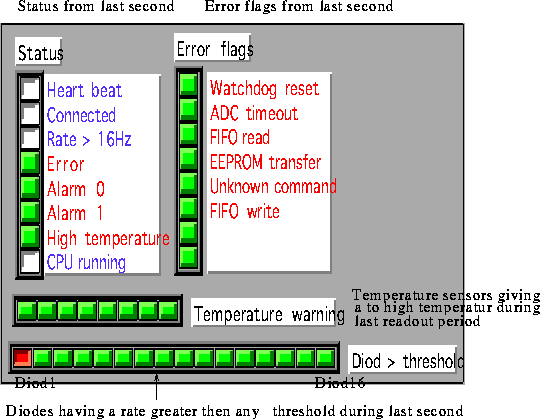
The status panel shows the same 'status' pattern as given on the front panel LEDs on the RMAC card. The 'error flags' shows if there is any internal error reported from RmacMON. The status of the eight temperature sensors are displayed in 'temperature warning' . If any of the input channels has a rate greater then any of the alarm thresholds is the corresponding flag in 'Diode > threshold' set. All patterns are updated each second.
The normal status is CPU running ON, Heart beat blinking with a period of one second, Remotely connected ON, and errors OFF. Rate and alarm indicators depends on beam conditions
| Error flag | meaning |
| Watchdog reset | The CPU was reset by a watchdog timer |
| ADC timeout | The temperature ADC did not convert |
| FIFO read | An error occurred while reading the input FIFO |
| EEPROM transfer | An error occurred while reading/writing the EEPROM |
| Unknown command | A not understood command was received |
| FIFO write | An error occurred while writing the output FIFO |
| - | NOT DEFINED |
| - | NOT DEFINED |
Control panel
This section describes the control panel. The control panel is
used to set/change parameters on the RMAC, and is enabled with
the CONTROL button in the main RmacView display.
The STOP action is in the control panel,
to avoid stopping the run by accident. The panel contains the
current parameter set, and a menu to issue commands to RmacMON.
A command is selected by clicking in the menu, this will show
the EXECUTE button. Pressing EXECUTE makes
a window with the possible actions to appear. Press OK
to send the command, CANCEL to avoid it. It
may take some time to get the response from the RmacMON. RmacMON
writes an acknowledge buffer in the FIFO when the command has
been performed. RmacVIEW do not get the acknowledge until it has
read all previous buffers stored in the FIFO, if RmacVIEW has
not got enough CPU time many result buffers may be in the FIFO
before the acknowledge buffer. The command status is
set to 'executing' while waiting for the acknowledge, 'OK'
when acknowledge received. Otherwise is an error message written.
Press EXIT to exit from the control panel. The control
panel shows the current parameter settings:
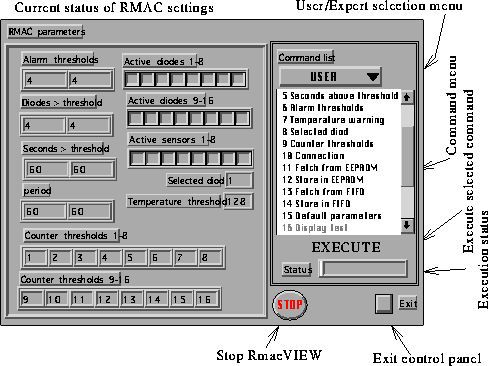
Below is the content of the command menu shown, together with the meaning of each command. Commands written in bold are available when in USER mode, other commands only in EXPERT mode.
The current parameters in use are stored locally on the RMAC card. If they are to be used as the default parameters (i.e. after a power on) then they must be stored permanently on the onboard EEPROM memory. This is done by choosing the Store in EEPROM command, and selecting the parameter set 0. Other parameter sets are not used at power on, but is intended for alternative user defined parameters. With the command Fetch from EEPROM can these parameters be used. The RmacMON program contains default settings, activated with Default parameters.
| Command entry | Action done |
| Active diodes | change the status of active diodes |
| Active sensors | change the status of active temperature sensors |
| Alarm periods | set the major alarm periods |
| Diodes above threshold | set the number of diodes required to be above the alarm thresholds |
| Seconds above threshold | set the number of seconds during an alarm period for which the alarm conditions must be fulfilled |
| Alarm thresholds | set the alarm thresholds |
| Temperature warning | set the temperature warning threshold |
| Selected diode | set the selected diode for rate monitoring |
| Counter thresholds | set all the counter thresholds |
| Connection | connect/disconnect external communication |
| Fetch from EEPROM | fetch a parameter set from EEPROM |
| Store in EEPROM | store the current parameters as a parameter set in EEPROM |
| Fetch from FIFO | fetch parameters from FIFO(not implemented) |
| Store in FIFO | store current parameters in FIFO |
| Default parameters | use program default parameters |
| Display test | perform test of LED display and relayes |
| DAC test | perform test of the DAC outputs |
| Logic test | perform logic test |
| Read EEPROM | read the content of EEPROM from a given address |
| Write EEPROM | write a value in EEPROM at a given address |
| Get ADC | store the ADC buffer in FIFO |
| Get counters | store current counter values in FIFO |
When the program looses the connection with the RMAC card, appears a dialog box with the options STOP and CONTINUE. Pressing STOP will abort the program, and CONTINUE makes the program to retry. Possible reasons for a connection loss are:
FadcVIEW
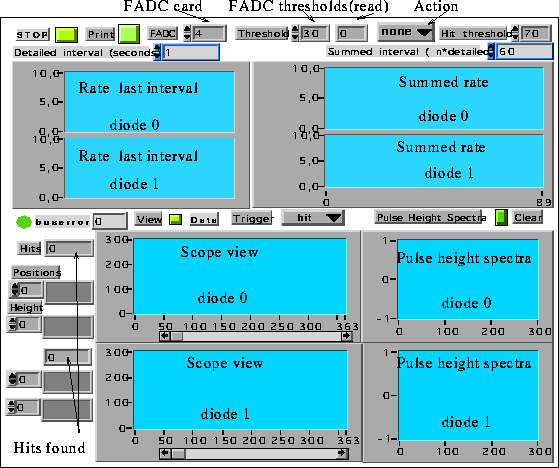
FadcVIEW is a program used for monitoring the diode signals. The program reads a specified FADC card (FADC) and searches for pulses above a software threshold (Hit threshold). The hardware threshold (Threshold) can at any time be loaded or read (Action). The rate is displayed in two graphs, detailed rate and summed rate. The detailed rate is the number of pulses during the last detailed interval, and the summed is the average rate during a longer time period. For each pulse found is the position and pulse height shown as numbers (Hits found). The pulse height distribution is shown in a histogram (Pulse Height Spectra), the histogram can be cleared with Clear.
A scope view of the FADC memory content is plotted when pressing View button, data is either taken without requirements or a pulse is required (Trigger).
The current display is printed with Print.
FadcVIEW is intended as a monitor program, and should not run continuously together with RmacVIEW, since it takes to much CPU time from the former program.
The logfiles generated on the MacIntosh are regularly transferred (normally once a night) to a main computer for analysis. For this purpose must the FTP daemon run on the MacIntosh. When the logfiles has been transferred are they analysed by a program (written in C). Result files are generated, one file per day. These files are with the use of PAW transferred into PostScript and GIF formats. The plots generated are:
Each plot is made for one whole 24-hour day cycle, and is available either in PostScript(.ps) or GIF(.gif) format. An example of the plots is shown below.

A summary of the logfiles is stored in a monthly summary file.
The summary file contain information about start of run, end of
run, commands to RmacMON.
20 May, 1996
References
1 RMAC, radiation Monitor Alarm card LUNFD6/(NFFL-7123) 1996, Björn Lundberg, Ulf Mjörnmark