During the first run period RHIC provided Au-Au collisions at
![]() GeV. The primary interaction trigger was based on information from the two BBC. The
trigger required a coincidence where at least two photo-multipliers on each side fired.
From simulations it was found to correspond to 92% of the nuclear interaction cross
section of 7.2 barns. A total of about
GeV. The primary interaction trigger was based on information from the two BBC. The
trigger required a coincidence where at least two photo-multipliers on each side fired.
From simulations it was found to correspond to 92% of the nuclear interaction cross
section of 7.2 barns. A total of about
![]() such minimum bias events were used
in the net charge fluctuation analysis, which is based on information from the
drift chamber and the first pad chamber plane in the west tracking arm.
These detectors cover approximately 0.7 units in pseudorapidity and 90
in azimuth.
The vertex positions of the collisions were mainly retrieved from time measurements
in the two BBC.
A rather tight vertex cut of
such minimum bias events were used
in the net charge fluctuation analysis, which is based on information from the
drift chamber and the first pad chamber plane in the west tracking arm.
These detectors cover approximately 0.7 units in pseudorapidity and 90
in azimuth.
The vertex positions of the collisions were mainly retrieved from time measurements
in the two BBC.
A rather tight vertex cut of ![]() cm was applied to get a homogeneous
event sample, where background from interactions in the magnet iron was avoided.
cm was applied to get a homogeneous
event sample, where background from interactions in the magnet iron was avoided.
Results from the data were compared to simulations using the RQMD [21]
event generator, PISA and detector response code. The simulations also gave
information on reconstruction efficiencies and background contributions.
The reconstruction efficiency was shown to fall rapidly for particles with
![]() below 0.2 GeV/c, implying exclusion of tracks with
below 0.2 GeV/c, implying exclusion of tracks with ![]() GeV/c from
the real data sample. The overall efficiency for detecting charged particles
was then found to be about 80%, both for positive and negative particles.
Background contributions, e.g. from interactions in detector material and
weak decays, were estimated to about 20% of the reconstructed tracks.
GeV/c from
the real data sample. The overall efficiency for detecting charged particles
was then found to be about 80%, both for positive and negative particles.
Background contributions, e.g. from interactions in detector material and
weak decays, were estimated to about 20% of the reconstructed tracks.
The acceptance coverage ![]() of the detectors was estimated from the simulations to
be 0.018. A value of
of the detectors was estimated from the simulations to
be 0.018. A value of
![]() was measured from the data sample, and
charge asymmetry effects for
was measured from the data sample, and
charge asymmetry effects for ![]() can be shown to be negligible.
The expected reduction in the net charge fluctuations, due solely to global
charge conservation, then yields
can be shown to be negligible.
The expected reduction in the net charge fluctuations, due solely to global
charge conservation, then yields
Fig. 3.9 shows
![]() and
and ![]() for each value of
for each value of ![]() .
.
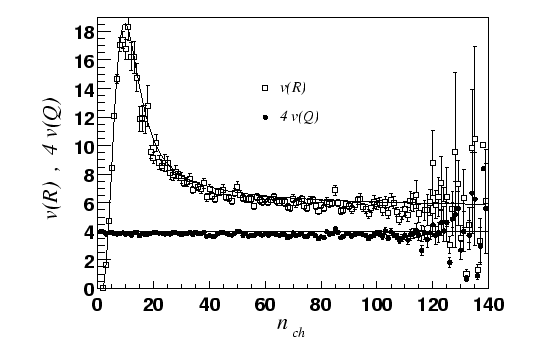 |
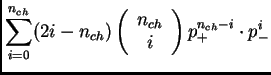
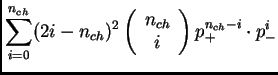
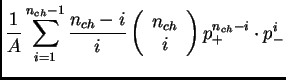
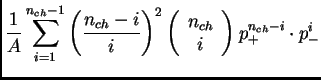
The data points are compared to a purely stochastic behavior (solid curves), calculated from
where
![]() is the new normalization needed when
discarding events with
is the new normalization needed when
discarding events with ![]() or
or ![]() equal to zero, in the case of
equal to zero, in the case of ![]() .
The figure shows that the use of
.
The figure shows that the use of ![]() introduces complications.
introduces complications.
![]() has a strong dependence on
has a strong dependence on ![]() and
and
![]() .
The values are understood only when comparing to the stochastic curve,
but for event classes with varying
.
The values are understood only when comparing to the stochastic curve,
but for event classes with varying ![]() it is not straightforward to calculate
such a curve.
it is not straightforward to calculate
such a curve.
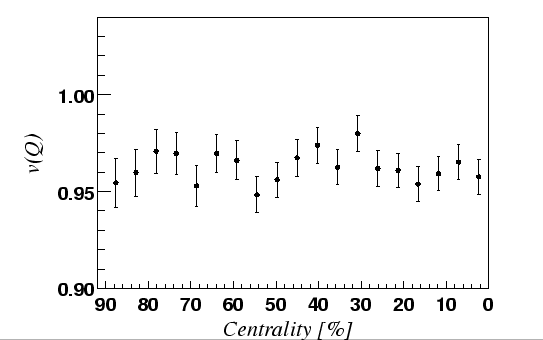
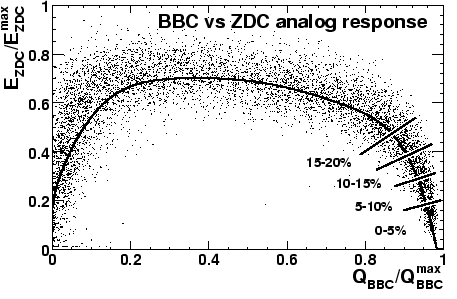
Figure 3.10 displays ![]() as a function of increasing centrality.
The centrality is divided into 20 classes, which are determined from the BBC
and ZDC information as shown in fig. 3.11.
The rightmost data point in fig. 3.10 corresponds to the 0-5% most
central events.
as a function of increasing centrality.
The centrality is divided into 20 classes, which are determined from the BBC
and ZDC information as shown in fig. 3.11.
The rightmost data point in fig. 3.10 corresponds to the 0-5% most
central events.
The magnitude of the fluctuations does not depend on centrality.
For the 10% most central events, the value
is
![]() . If the difference when applying (3.19)
is taken to be a systematic error the result is
. If the difference when applying (3.19)
is taken to be a systematic error the result is
| (49) |
However not as drastic as was predicted with a QGP transition,
there is a clear reduction compared to the expected value from
(3.32). Taking the limited geometrical acceptance of
the detector into account, the result is consistent with the
resonance gas prediction mentioned on page ![]() .
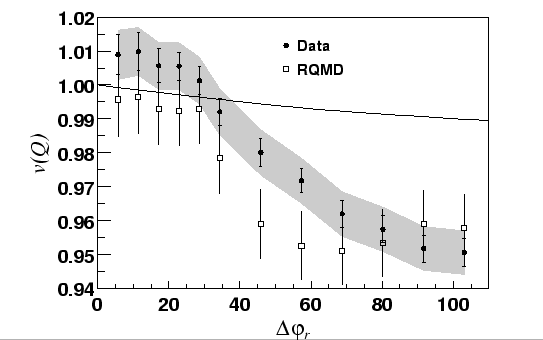
With larger acceptance the probability to detect both charged decay
particles from neutral resonances increases. This is seen in fig. 3.12,
where
.
With larger acceptance the probability to detect both charged decay
particles from neutral resonances increases. This is seen in fig. 3.12,
where ![]() , for the 10% most central events, is displayed as a
function of
, for the 10% most central events, is displayed as a
function of
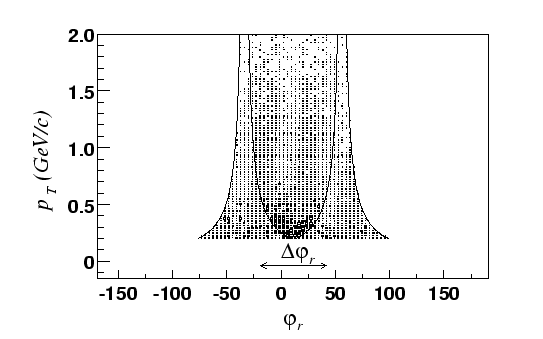
![]() . (Here
. (Here ![]() denotes the reconstructed
azimuthal emission angle of a particle, and
denotes the reconstructed
azimuthal emission angle of a particle, and
![]() defines the region
where particles are accepted in the analysis, explained further by fig. 3.13.)
Above
defines the region
where particles are accepted in the analysis, explained further by fig. 3.13.)
Above
![]() =40 the behavior of
=40 the behavior of ![]() clearly deviates from
what is expected solely from global charge conservation (the solid curve).
Fig. 3.12 also shows good qualitative agreement between the data and
the RQMD simulation.
clearly deviates from
what is expected solely from global charge conservation (the solid curve).
Fig. 3.12 also shows good qualitative agreement between the data and
the RQMD simulation.
 |
 |