next up previous contents
Next: Results Up: Monte Carlo Previous: The pT cut-off

Comparison with data

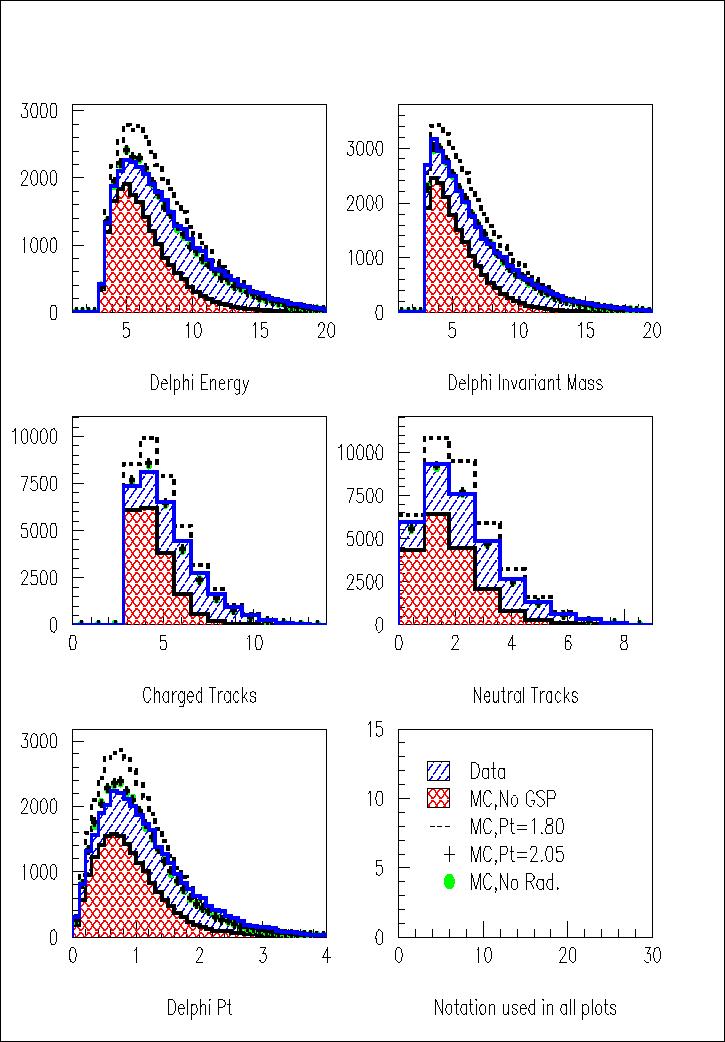
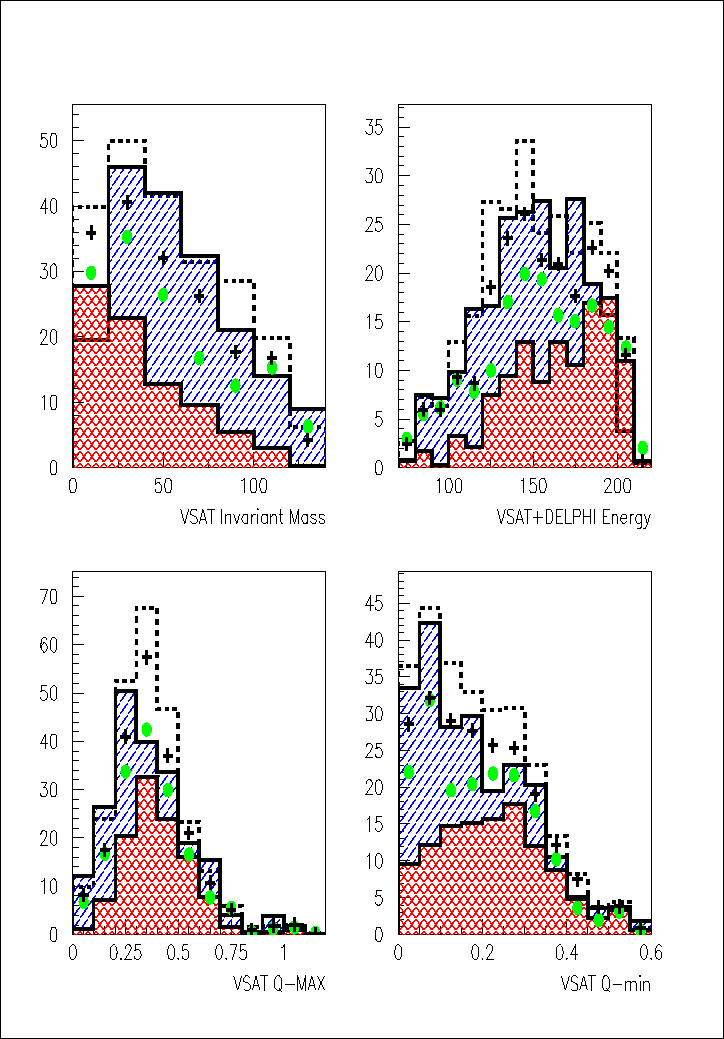
All observables should be measured for both data and MC, to make sure that MC can describe the data in a satisfactory way at all instances. Data and MC were compared for the whole LEP II period to increase the statistics, the individual data set did however also show excellent agreement. Comparisons were made for pTmin equal to 1.8, 2.05 and 6.0 for normal MC (200 GeV MC extracted as before) and for pTmin at 2.05 for MC without radiative corrections. In the following plots the data and MC has been cut with the cut-maps and the expected remaining background distributions have been subtracted. The remaining number of events is shown on the y-axis and the following data was examined:

Figure 7.7: VSAT single tag data.

Figure 7.8: VSAT double tag data, observables taken from the e+e- system.
\begin{figure}
\centering\epsfig {file=gg_vsa_vsa_2.eps,width=16cm,height=23cm} \end{figure}

Figure 7.9: Quantities from the hadronic system in VSAT double tag data, notation as Fig. 7.7.

Figure 7.10: STIC+VSAT double tag data, quantities from the hadronic system.
\begin{figure}
\centering\epsfig {file=gg_sti_vsa_1.eps,width=16cm,height=23cm} \end{figure}

Figure 7.11: STIC+VSAT double tag data, measurements from the the e+e- system.


next up previous contents
Next: Results Up: Monte Carlo Previous: The pT cut-off
Andreas Nygren
2001-10-24