The random trigger in DELPHI is caused by a signal from a scintillator
placed close to a radioactive source.
It is used to select an unbiased
sample of events when no real interaction has occurred.
The events taken
with the random trigger during the first part of the 1999 LEP run
(![]() 40pb-1) has been studied.
Both the A- and the B-processing has been used.
40pb-1) has been studied.
Both the A- and the B-processing has been used.
The advantage of using random triggers compared to Bhabha events is that it makes it possible to go down to lower energies. The disadvantage is a smaller event sample. There is also the possibility that the off-energy electrons background is correlated in time to interactions and that the random sample therefore underestimates the off-energy background.
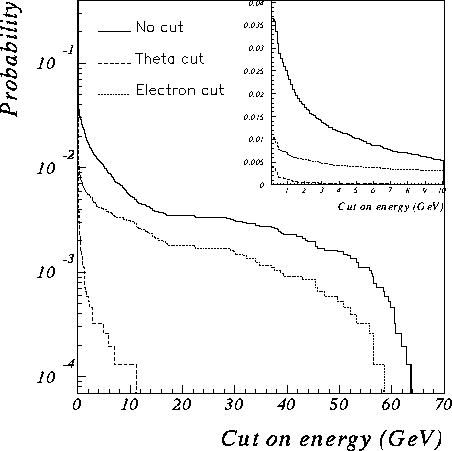
The probability of a STIC shower in a random triggered event as a function of a cut on the STIC energy is depicted in Figure 15. The probability has been calculated for all events with a shower in STIC and for the subsamples when the veto scintillator counters identify the incoming particle as an electron [6] and when the shower has a polar angle of more than 3 degrees.
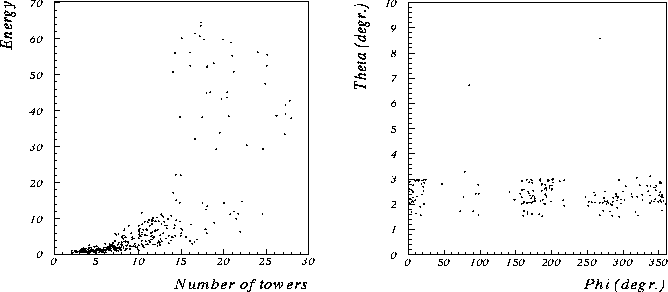
The most effective way of removing the off-energy background is, as stated previously, by a cut on the polar angle. This is illustrated in the right plot in Figure 16 which shows the theta-phi distribution of the off-energy electrons in the random triggered sample.
 |
By requiring a confirmation of the electron from a signal in the veto-counters a sizeable part of the background may be rejected. The reason is that many of the off-energy electrons enter STIC from behind or below the tungsten shield. In principle, the reason could also be that the STIC showers are caused by noise and not by off-energy electrons. That this is not the case can be seen in the left plot of Figure 16, which shows the energy of the showers versus the number of towers used in the shower reconstruction. A shower caused by noise has only one tower in the reconstruction and no showers like this were found with an energy larger than 0.5 GeV.
Table 8 gives the probability for an off-energy electron in STIC
for different cuts on energy.
An analysis which veto events with more than
0.5 GeV in STIC will lose 3% of the signal.
In a search analysis which ends with 10 candidate events
the probability of at least one off-energy electron
in the events with more than 2.5 GeV is 15% while the probability
of such a shower higher than
![]() > 3o in the 10 events
is only 0.5%.
> 3o in the 10 events
is only 0.5%.
The probability of charged tracks in the events is 52%![]() 6%,
when the energy in STIC is larger than 10 GeV.
The tracks are similar to the ones found in the Bhabha sample.
6%,
when the energy in STIC is larger than 10 GeV.
The tracks are similar to the ones found in the Bhabha sample.
 |
A comparison of the probability obtained at Emin=10 GeV with the Bhabha
sample (
![]() = 0.43
= 0.43![]() 0.02) and the random triggered sample
(
0.02) and the random triggered sample
(
![]() = 0.53
= 0.53![]() 0.06) shows a barely significantly higher
value for the random sample (contrary to naive expectations).
This could be due to the fact the time period studied
in the two analyses was not exactly the same.
0.06) shows a barely significantly higher
value for the random sample (contrary to naive expectations).
This could be due to the fact the time period studied
in the two analyses was not exactly the same.