Svenska:
Den här webbplatsen kan endast nås som arkivreferens. De officiella webbsidorna för avdelningen för partikelfysik finns på http://particlephysics.physics.lu.se
Sidan nedan slutar uppdateras fr.o.m. 2020-09-22 och uppfyller endast delvis tillgänglighetsdirektivet. Se tillgänglighetsredogörelsen
English:
The webpage you reached is made available for archiving purposes only. The official division of particle physics webpages can be found at http://particlephysics.physics.lu.se
The page below is not updated any longer since September 22, 2020 and does not conform completely to the accessibility regulation. See the accessibility statement


Next: Summary and conclusions.
Up: note
Previous: Random triggers
The other DELPHI calorimeters have also been studied by using the
random triggered sample.
At angles above STIC the calorimeters do not see any of the
off-energy electron background.
Instead they suffer from noise showers and occasional
showers created by cosmic rays.
In the 1999A data, a noisy area in HCAL which created high energy
showers was observed, but was removed in the 1999B processing
(Figure 17).
The left plot in Figure 18
and Table 9 gives the probability of a noise-shower
in different calorimeters
as a function of a cut on the shower energy.
Figure 17:
The theta-phi distribution of noise showers in HAC in the
1999A data (left) and the 1999B data (right).
The middle plot shows the energy distribution of the peak
in the theta-phi distribution.
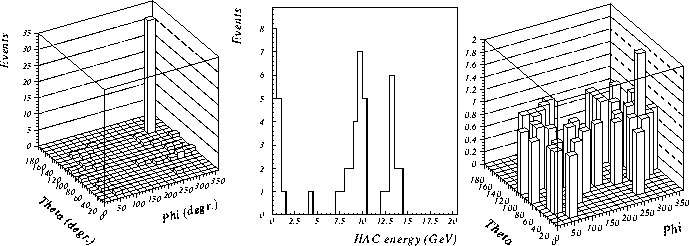 |
Figure 18:
Left: The probability of a shower in different
calorimeters as a function of acut on the shower energy.
The data used were triggered by the random trigger
and come from the 1999 B-processing.
Right: Noisy areas in the FEMC calorimeter during the 1999 data taking.
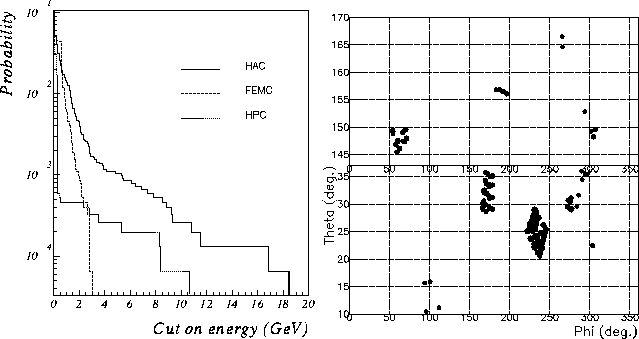 |
Table: 9
The probability of a shower with energy higher than Emin
in HAC, FEMC and the HPC.
| Emin [GeV] |
 HAC[%] HAC[%] |
FEMC[%] |
HPC[%] |
| 0.1 |
5.15 0.18 0.18 |
4.470.17 |
3.120.14 |
| 0.5 |
2.210.12 |
4.420.17 |
0.050.02 |
| 2.5 |
0.250.04 |
0.050.02 |
0.040.02 |
| 5.0 |
0.100.03 |
- |
0.030.01 |
|
The probability plots in Figure 18 are of course only useful
for analyses which does not select events based on
energy in the calorimeters.
If one takes the FEMC as an example,
the probability of a noise-shower with energy larger than 2.5 GeV
on top of a physics events is completely negligible.
If on the other hand single photon events are selected by triggering
on energy in FEMC and by not requiring any signals in any
other DELPHI detectors (which would confirm the event to be a
genuine physics event), events caused by noise in FEMC are selected.
In this way one can find hundreds of single photon events in FEMC
caused by fake showers.
This is illustrated in the left plot of Figure 18
which shows noisy areas in the 1999B FEMC data.
In this plot, only noisy areas producing showers larger than 2.5 GeV which
survive the Margoni offline noise algorithm are included.
Next: Summary and conclusions.
Up: note
Previous: Random triggers
Andreas Nygren
1999-11-17