From Eq. 4.1 it is clear that the cross section for Bhabha events increases rapidly at small angles, which makes the VSAT position at 3-8 mrad ideal for Bhabha measurements. Unfortunately the off-energy background also increases at small angles, and the VSAT is flooded by background hits. There is a certain probability that two off-energy electrons will hit two of the VSAT diagonal modules at the same time, and this will thus be triggered as a Bhabha event.
This so-called false Bhabha rate can be quite high (Fig.
3.6) and disturbs the VSAT Bhabha measurement. As the
Bhabha process is elastic, both of the scattered outgoing
electrons have the same energy and an opposite momentum. A Bhabha
event can therefore be quite well contained in a circular area
(due to the detector resolution) around beam energy (Fig.
4.1). The positions of the electron and positron in both x
and y are strongly related as they are back to back. To isolate
the Bhabha sample further an elliptical cut in
![]() x(= xe- + xe+) and
x(= xe- + xe+) and
![]() y(= ye- + ye+) is made,
shown in Fig. 4.2.
y(= ye- + ye+) is made,
shown in Fig. 4.2.
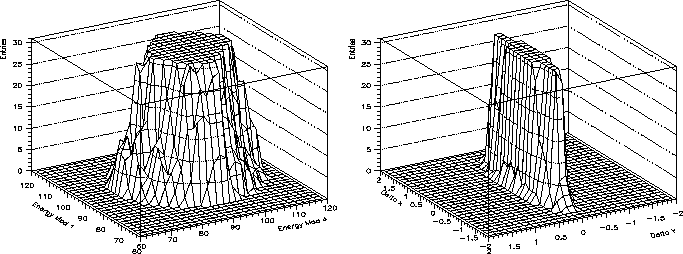 |
The quadrupole that is placed in front of the VSAT focus the
scattered electrons in the vertical plane and have a defocusing
effect in the horizontal. This is the reason for that the
distribution in Fig. 4.2 is more narrow in ![]() y.
The two cuts removes about 80% of the false Bhabha background,
resulting in a Bhabha purity above 90%.
y.
The two cuts removes about 80% of the false Bhabha background,
resulting in a Bhabha purity above 90%.