The geometry of the VSAT detector and the quadrupole can not be determined to a high precision, as there is no line of sight through DELPHI. The precise shape of the flange in front of the VSAT is not known as well as one would like. The exact amount of remaining background in the Bhabha sample also suffers from some uncertainty. The accepted Bhabha cross section for the VSAT also depends on some beam-parameters that varies during data taking.
All this makes accurate absolute luminosity measurements by the VSAT difficult, which means that the VSAT absolute luminosity has to be calibrated to an accurate and well known luminosity measurement [19]. The relative luminosity measured by the VSAT is on the other hand quite accurate. Fortunately DELPHI has a second detector closer to the interaction point and at larger polar angle to measure the integrated luminosity. This is the STIC detector and it has much lower systematical error than VSAT and provides a fixed absolute luminosity measurement. The STIC has however much higher statistical error than VSAT as it collects much less data, about a factor of 15 for LEP II.
The average VSAT Bhabha cross section cannot simply be extracted by dividing the number of recorded Bhabhas with the STIC luminosity. As mentioned in the previous section, there is still some background left in the VSAT Bhabha sample, which needs to be subtracted before the average cross section can be obtained.
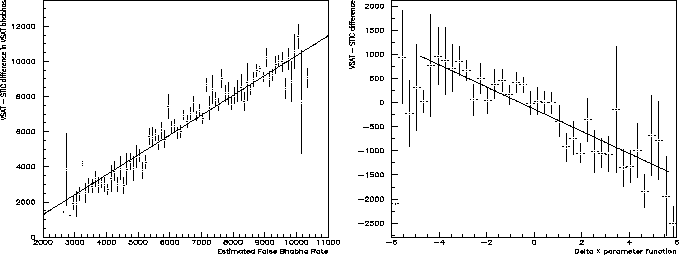
As shown in section 3.2 four different methods are used to extract the expected false Bhabha background rate in the Bhabha peak. These are linearly combined and are fitted simultaneously with the VSAT Bhabha cross section against the VSAT-STIC luminosity difference (Fig. 4.3). As there are two free parameters (the Bhabha cross section and the background rate) this cannot be done in one fit, so a number of fits are done converging to a minimal VSAT-STIC luminosity difference.
 |
To improve the VSAT luminosity measurement further the variations
of the accepted Bhabha cross section (
![]() ) have to be
taken into account [20]. It has been found that the
cross section varies with the beam acollinearity (=angle between
the beams) in both x and y. The average tilt and the width of the
beams in x also changes the VSAT Bhabha cross section. Fortunately
all these parameters can be estimated and parameterized by
quantities measured by the VSAT detector [21]. The
Bhabha diagonals are treated separately and the corrected VSAT
cross section can be expressed as:
) have to be
taken into account [20]. It has been found that the
cross section varies with the beam acollinearity (=angle between
the beams) in both x and y. The average tilt and the width of the
beams in x also changes the VSAT Bhabha cross section. Fortunately
all these parameters can be estimated and parameterized by
quantities measured by the VSAT detector [21]. The
Bhabha diagonals are treated separately and the corrected VSAT
cross section can be expressed as:
The ![]() x and
x and ![]() y are the same as before,
y are the same as before,
![]()
![]() x is the width of the
x is the width of the ![]() x distribution and
AS is the counting asymmetry between the Bhabha diagonals. The
constants A,B,C,D and E have to be determined by a fit to STIC
data. This is a quite wide parameter space, so each parameter is
first fitted individually (Fig. 4.4) and then a number
of Monte Carlo (random selection of numbers, normally within some
allowed ranges) generations are performed from that. They converge
to a set of numbers that gives the smallest VSAT-STIC luminosity
difference.
x distribution and
AS is the counting asymmetry between the Bhabha diagonals. The
constants A,B,C,D and E have to be determined by a fit to STIC
data. This is a quite wide parameter space, so each parameter is
first fitted individually (Fig. 4.4) and then a number
of Monte Carlo (random selection of numbers, normally within some
allowed ranges) generations are performed from that. They converge
to a set of numbers that gives the smallest VSAT-STIC luminosity
difference.
In all of the fits used for luminosity normalization it is important to only use half of the available data. The second half is needed to verify that the normalizations indeed improved the VSAT luminosity and not only some statistical difference between VSAT and STIC. The amount of data in each of the data-points cannot be too small, as the STIC statistical error then would be too big. To get a good and reliable result, a number of different set of data points were tried in blocks ranging from 500 to 1200 STIC Bhabhas. The fitted parameters should not depend on the block size of the data, which is a second verification that they have been correctly extracted.